 Reading Time: 4 minutes read
When analyzing survey responses, it’s easy to stick to the familiar bar charts, pie charts, and line graphs. While those tools are great, there are other tools that you can use to delve deeper into your data for richer insights.
Let’s start with the following terms: mean, confidence interval at 95%, standard deviation, and standard error. These values are all calculated for single choice questions asked in a survey in QuestionPro. You’ll find them at the bottom of the charts for each question.
What does mean…mean?
The mean is the average value from a group of values. Basically, looking at the mean, you can infer that, on average, people responded with that value.
In the example below, the question had to do with what day people would be most likely to attend an event. Because most surveys ask respondents to answer using text-based values instead of numerical values, each answer option was assigned a number: Monday – 1, Tuesday – 2, Wednesday – 3, and so on, through Sunday – 7. This allows us to run calculations while still keeping text values available for our respondents. You’ll see below that the mean was about 5, which was assigned to the answer “Friday.” On average, then, people were most likely to attend a Friday event.
How confident can I be?
The next value you’ll see is the confidence interval at 95%. This simply means that 95% of the time, we can be certain that respondents’ answers would fall in this range. Going back to the question about what day people would be most likely to attend an event, we see that 95% of the time, respondents’ answers fell between 4.8 and 5.6. When we relate that back to the value for each answer, that lines up to support the average answer of Friday.
What’s a standard deviation?
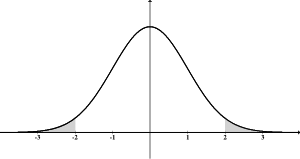
Here is where we get into a bit more statistical parlance. Standard deviation has to do with the distribution of answers received. Generally, answers to questions fall on what is referred to as a “normal distribution” curve, or a bell curve. Looking at this curve, we can infer that most answers would fall somewhat close to the average, or mean. The answers that fall on the edges are called outliers.
If you talk to a statistician, you may hear things like, “values within one standard deviation.” If the data gathered followed a normal distribution, or bell curve, this means that about 68% of the values are in this standard deviation. Two standard deviations account for about 95% of the answers. Three standard deviations account for about 99.7% of the answers. Anything outside of the three standard deviations is a definite outlier.
If a standard deviation value is small, it means that about 68% of the answers were really close to the mean, or average answer. If the standard deviation value is large, it means that the answers received were more spread out.
What’s a large or small standard deviation? Well, it depends on the question asked and the values recorded. For the question we’re investigating about event dates, we only had eight options. So, a standard deviation of 2.1 tells us that 68% of the answers to this question were between the values 3.1 and 7.2 (mean plus and minus that standard deviation value). When we look at the values for each answer option, that means about 68% of our responses were between Wednesday and Sunday. If that standard deviation had been smaller, then we could have inferred a time span closer to Friday (say, Thursday through Saturday).
If we had asked a question with a 100-answer question set, a small standard deviation might be 5, while a large standard deviation might be 30.
For our example, we could say that the mean was plus-or-minus the standard deviation. With a standard deviation of 2.1, that’s about two days. So, we would say that our average response was Friday, plus-or-minus two days, which broadens the answers to Wednesday through Sunday. (Note: this shows that answers were pretty spread out!)
Standard Error
The standard error calculated by QuestionPro is the standard error of the mean. This value is a reflection of how accurate our data represents the population we’re studying, and, for those interested in the math behind it, is calculated by dividing the standard deviation by the square root of the sample size. A high standard error means we’re not representing the population very well. A low standard error means we’re representing the population better. The more responses you get to a survey, the more representation you’re getting for the population you’re studying, which, in turn, means the standard error will decrease. In statistical terms, standard error is the standard deviation of the sample mean from the population mean. In plainer terms, it’s how far off our mean that we calculated from the sample we studied is from the mean we would get if we were able to get the entire population to answer the survey. The trick here is that standard error does not deal with the individual values, only the mean.
In our example, the standard error was 0.2. Applied, we could say that the mean was 5.2 plus or minus 0.2. Our sample’s answer was within 0.2 of the population’s answer, if the entire target population for our study had answered the survey.
Summary
Hopefully, this gives you a bit more understanding of means, confidence intervals, standard deviations, and standard errors. The next time you read about or listen to statistics given about a study, pay attention and see if they use these terms!


