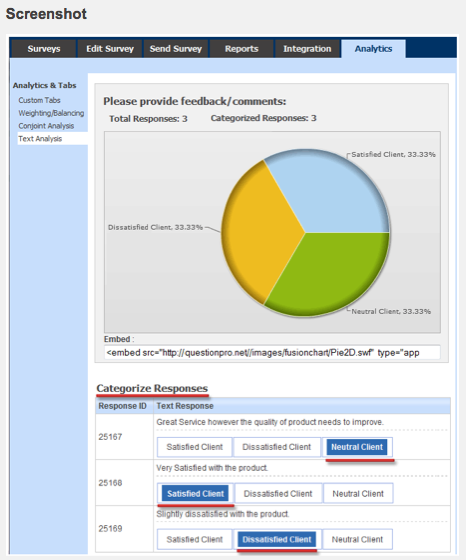
We are pleased to announce the launch of our latest analytics module – Text Analysis/Tagging.
We’ve spent some time researching different options on analyzing open-ended text data within surveys. We’ve looked at integrating with other third-party vendors to do automatic “sentiment analysis” to a simple “tag cloud” – and after some user testing and research we’ve decided to a simple but effective tagging and categorization model. Here is how it works:
- View all the comments (20 at a time)
- Create dynamic “Tags” to represent sentiment
- Quickly categorize your open-ended text – with minimal screen refreshes
- Pie Charts to visualize the data.
With the Survey Analytics Enterprise Platform you can analyze text data. For this you can set up Text Categories. Go to:
* Login » Surveys » Analytics » Analytics Tabs » Text Analysis
Text Category can be set up on an Open Ended Text – Comments Box type question.
* Click on the Add New link for adding a new category.
* Enter in the name for the category.
* For the Text Response click on the Category Name to assign the category.
* Repeat the steps for each response
Once you have categorized all responses under the appropriate categories, you can view pie-chart reports for the categorized data.


