On Thursday October 28th, 2010 SurveyAnalytics teamed up with Andrew Jeavons to present ” Learn How To Do a Conjoint Analysis Project in 1 Hour.”
Over 47 people signed up to learn more on this topic indicating a great deal of interest in adding conjoint analysis to online surveys.
Questions that were answered in our presentation included:
1) What is Conjoint Analysis and how does it work to calculate your respondents’ trade-off decisions?
2) How can you develop Conjoint Studies that provide actionable data for new products/services?
3) How can Conjoint Studies help you predict potential market share for new product concepts? Can you simulate this?
Conjoint analysis is a method developed over the past 50 years by market researchers and statisticians to predict the kinds of decisions consumers will make about products by using questions in a survey.
The central idea is that for any purchase decision consumers evaluate or “trade off” the different characteristics of a product and decide what is more important to them. For instance , it may be that the container size is the most important factor, or it may be environmental friendliness of the product and the price. Obviously for different products there are a whole range of possible characteristics or “attributes” that consumers may take into account.
Conjoint analysis is a way of presenting a set of possible products to consumers via a survey and ask them to make a choice about which one they would pick. A set of attribute for a product (perhaps color, size, price) are chosen and then a set of “levels” of the attributes are selects. For instance we could have 3 colors of a product, red, green and blue, then maybe 3 sizes, 4, 8 and 12 oz, then 3 prices, $10, $20 and $30 . This would give 3 x 3 x 3 possible product combinations.
A set of alternative “products” based on the attributes you have defined are presented to respondents who make choices as to which product they would purchase in real life. It is important to note that there are a lot of variations of conjoint techniques. SA uses a conjoint technique which we feel best simulates the purchase process of consumers.
Why Use Conjoint Analysis?
1) Help evaluate new products, or variations of products, against an existing range of products or a marketplace.
2) It is very expensive to develop a new product and then put it out into the marketplace with no guarantee of success.
3) Allows market researchers to simulate the decisions consumers would make in the market place.
4) See what effect changes in price of existing products may have on the sales of the product.
5) Get feedback on new products or variations of an existing product very quickly and at a low cost.
Setting up a Conjoint Analysis project with SurveyAnalytics is easy. You will be able to combine this question type with other standard to advanced question types available as well as use robust analysis tools that provide greater insight to your conjoint analysis project.
After sending out your survey you can instantly review a relative importance chart, utility values, and best/worst profiles.
The next step is to use the market segmentation simulator. This tool will give you the ability to “predict” the market share of new products and concepts that may not exist today. Ability to measure the “Gain” or “Loss” in market share based on changes to existing products in the given market.
Important steps in Conjoint Simulation:
1- Identifying and describing the different products or concepts that you want to investigate. We call these “Profiles”.
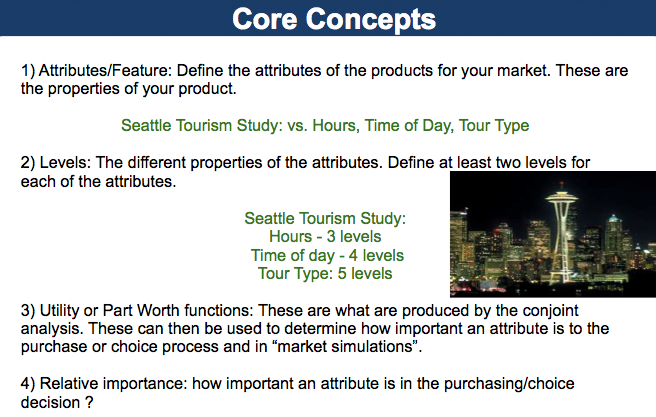
Example one of the profiles could be: Tour Type: Weird, Hours: 1-2 , Time of Day: Evening
2- Find out all the existing products that are available in that market segment and simulate the market share of the products to establish a baseline.
3-Try out new services and ideas and see how the market share shifts based on new products and configurations.
Example Market Segmentation Simulator and Analysis:
What can we analyze from the Market simulator?
In our first example what happens if have a tour of 1-2 hours as opposed to 4-6 hours in the afternoon for “Weird Seattle” ?
Answer: We find that the 1-2 hour tour would attract about 75% of the market share.
What is a good sample size to work with for Conjoint Studies?
Sample size is a question that comes up very frequently. Richard Johnson , one of the inventors of conjoint analysis, has presented the following rule of thumb for sample size in choice based conjoint:
(nta/C) > 500
Where n = the number of respondents, t= the number of tasks, a=the number of alternatives per task , C= the largest number of level for any one attribute.
So if you have 50 respondents, 3 tasks per respondent, 2 alternatives per task and the maximum number of levels on an attribute is 3 you get:
(50 x 3 x 2 x 3) = 900
The general opinion now seems to be that 500 may be too small a number, 1000 is a better value.
Generally speaking sample sizes tend to be around 200 – 1200 respondents, admittedly a wide range. It does seem that the value of 300 comes up most often for a single group of subjects.
For additional information please review our slides below. You may also post questions and comments and we will be happy to follow up with you.
Learn how to do a conjoint analysis project in 1 hrhttps://static.slidesharecdn.com/swf/ssplayer2.swf?doc=learnhowtodoaconjointanalysisprojectin1hr-101028155902-phpapp02&stripped_title=learn-how-to-do-a-conjoint-analysis-project-in-1-hr&userName=surveyanalytics
About the Presenters:
With over 25 years in the market research industry, Andrew Jeavons is a frequent writer and speaker for various publications and events around the country. He has a back ground in psychology and statistics, and currently focuses on innovation within survey research.

https://www.surveyanalytic


