 Reading Time: 3 minutes read
The statisticians can go home – long live the marketers! One of my friends was once on her email app – and instinctively looked for the “Like” button. Yes – she was looking for a like button on email. She had read an email and was so overjoyed by the contents – that she wanted to “like” the email.
Facebook gave us the “Like” button and that has profoundly shifted our emotional response mechanism for content. We all got behind it, fundamentally because it allows us to express our emotions easily. Facebook gave 7 billion users the button that connected emotions to actions. It’s the button that has connected almost everyone in the planet.
Facebook took it a step further with their “Reactions” – and gave us a bunch of emojis. Apple followed suit with emoji/gesture response to iMessage and text messages.
Surveys are typically executed by researchers and statisticians. Not by marketers. That does not mean survey questions have to be statistical in their data-collection model. Survey models have also evolved and we here @ QuestionPro have a few tricks that we know that customers love – when they take surveys.
I want to share some of them with you:
Smiley Rating Questions vs. Strongly Agree / Disagree
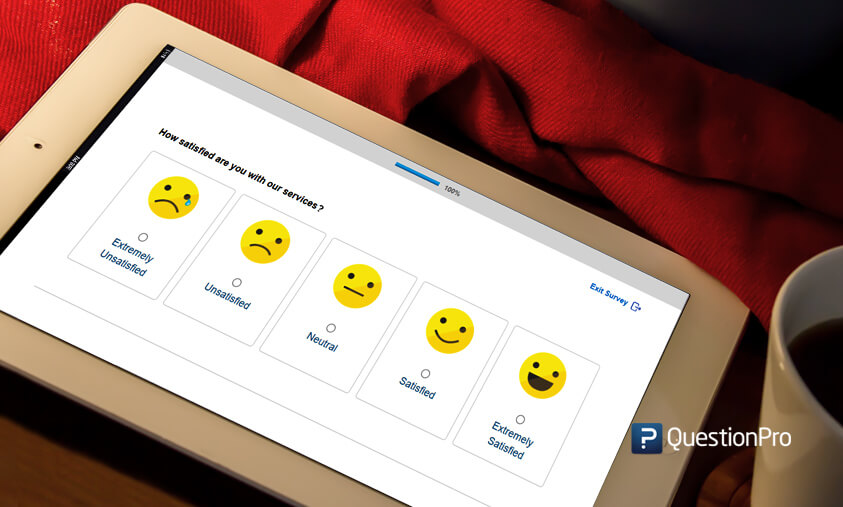
This simple change – where you pose a statement and have folks either agree with your or not – it a classical statistical measurement technique of the degree/strength of acquiescence to a statement. However, we don’t need to have a standard likert scale question with the words “agree’ and “disagree” – we can easily convert that to a Smiley Rating Question – where users choose between 5 emojis that represent each of the different states.
Matrix Questions vs. Slider Scales
In many cases – where a emotional (Happy -> Not Happy) may not simply apply. For example, if you want to measure the degree to which some feature in your tool is “working” or “not working” – you cannot really use a smiley there – but you can indeed use a slider. A slider scale is a visually interactive tool that users have to move to the right spot. It’s give the user an action to do – pick up the slider and move it to the spot that they feel comfortable.
Benefits of emotional vs. statistical models
There are three benefits this has :
- Increases Response Rates – Visual feedback and indicators always increase response rates. The actual increase is highly correlated and dependent on the demographics, but even for B2B Surveys – Executives are also humans who get text messages from their teenage kids – this mechanism works.
- Lower’s Cognitive Stress – It’s easier for respondents to choose 4 or 5 stars vs. reading the words agree and disagree. This is simple learned behavior. It also intuitively aligned with our emotions. Our emotions are not numeric.
- Engages and Improves Interactivity – We know interaction with images are much prefered by humans than numbers. We intrinsically have an easier time looking at images and media and understanding a situation than reading about it. Images do represent a 1000 words!


