 Reading Time: 3 minutes read
TURF analysis is a very powerful technique to estimate market potential for a particular product or service. Let’s use an example of an ice cream company that only has the resources to create two new flavors of ice cream. It would have to choose which flavor would satisfy the greatest quantity of its customers. There are thousands of different ice cream flavor combinations – how will the company decide which ones to produce?
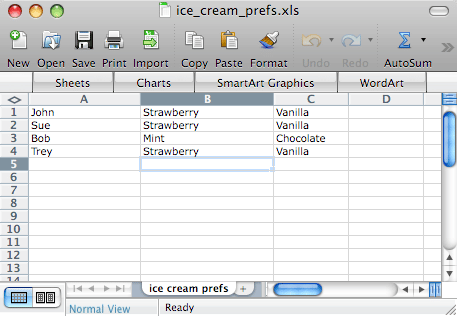
The simple solution is to run an online survey, asking respondents for their favorite ice cream flavors. Most people would pick the two flavors with the highest frequency in the survey data and start mixing up ice cream. However, this approach doesn’t always lead to the most customers. Why? Consider the following data from respondents who are asked, “Chose three of your favorite ice cream flavors from the list below.”
If you apply a simple frequency analysis to this data set, (essentially choosing the two ice cream flavors that were most popular) you’ll see that vanilla and strawberry were chosen most often. You might think that since these are the most selected, these must be the customer’s favorite ice cream flavors.
However, a simple TURF analysis will make you think twice about vanilla and strawberry. Let’s look at the data in Figure 8-9 again. As per our frequency analysis above, we would make John, Sue, and Trey quite happy (they choose vanilla and strawberry). Bob, on the other hand, would be bummed: we decided not to produce chocolate or mint – two of his favorite flavors. Our reach would be 75% of the population or three people (John, Sue, and Trey).
Eliminating duplicate choices
The goal of TURF analysis, in the case of the example above, attempts to answer this question: “What two combinations of flavors would satisfy the largest number of customers”. This is what is known as maximizing your reach. Taking a look at our data set once more, we see that choosing to produce any of these ice cream flavor combinations would give us a 100% reach: mint and strawberry, mint and vanilla, strawberry and chocolate, vanilla and chocolate. In other words, choosing to produce any of these combinations would satisfy the desires of John, Sue, Trey, and even Bob. Don’t you want to satisfy all of your customers?
Back to the example above, you can use the QuestionPro TURF Simulator to find the optimal choices that give you the maximum unduplicated reach. The tool runs through every possible configuration of choices at a time and gives you a sorted order of reach percentage.
Review the following steps using QuestionPro market research survey software as an example
1. Log in to your account. Use your user name and password to log in to your QuestionPro account.
2. Click on “My Surveys.” Click the “Reports” link next to the survey you’d like to analyze with the TURF simulator.
3. Click “TURF Analysis”. Choose the link in the left navigation bar titled, “TURF Analysis”.
4. Choose “Run Analysis”. Click the “Run Analysis” link next to the question you’d like to analyze. This will load up the data set.
5. Click the “Simulator” tab. This will take you into the TURF simulator
6. Choose the simulation count. Here you’ll pick the number of combinations you’d like to test. In the example above, we are looking for a combination of two flavors of ice cream, so we’ll choose “2” from the drop-down menu.
7. Click “Simulate Choices”. This will provide you with a report with every combination of ice cream flavor, sorted by reach percentage.
Learn More: Market Research Survey Software
More info:
- QuestionPro TURF analysis: https://www.questionpro.com/help/106.html
- TURF Analysis: http://en.wikipedia.org/wiki/TURF_Analysis


