 Reading Time: 2 minutes read
An interesting thing happened in Ohio politics a week or so ago, Rob Portman a Republican Ohio Senator “came out” to his constituents on his changing his opinion on gay marriage since finding out that his son was gay.
As you may have already realized this created all kinds of conversation on any politically-centered media channel. But I thought it might be fun to explore shifting opinions from a more data-driven perspective.
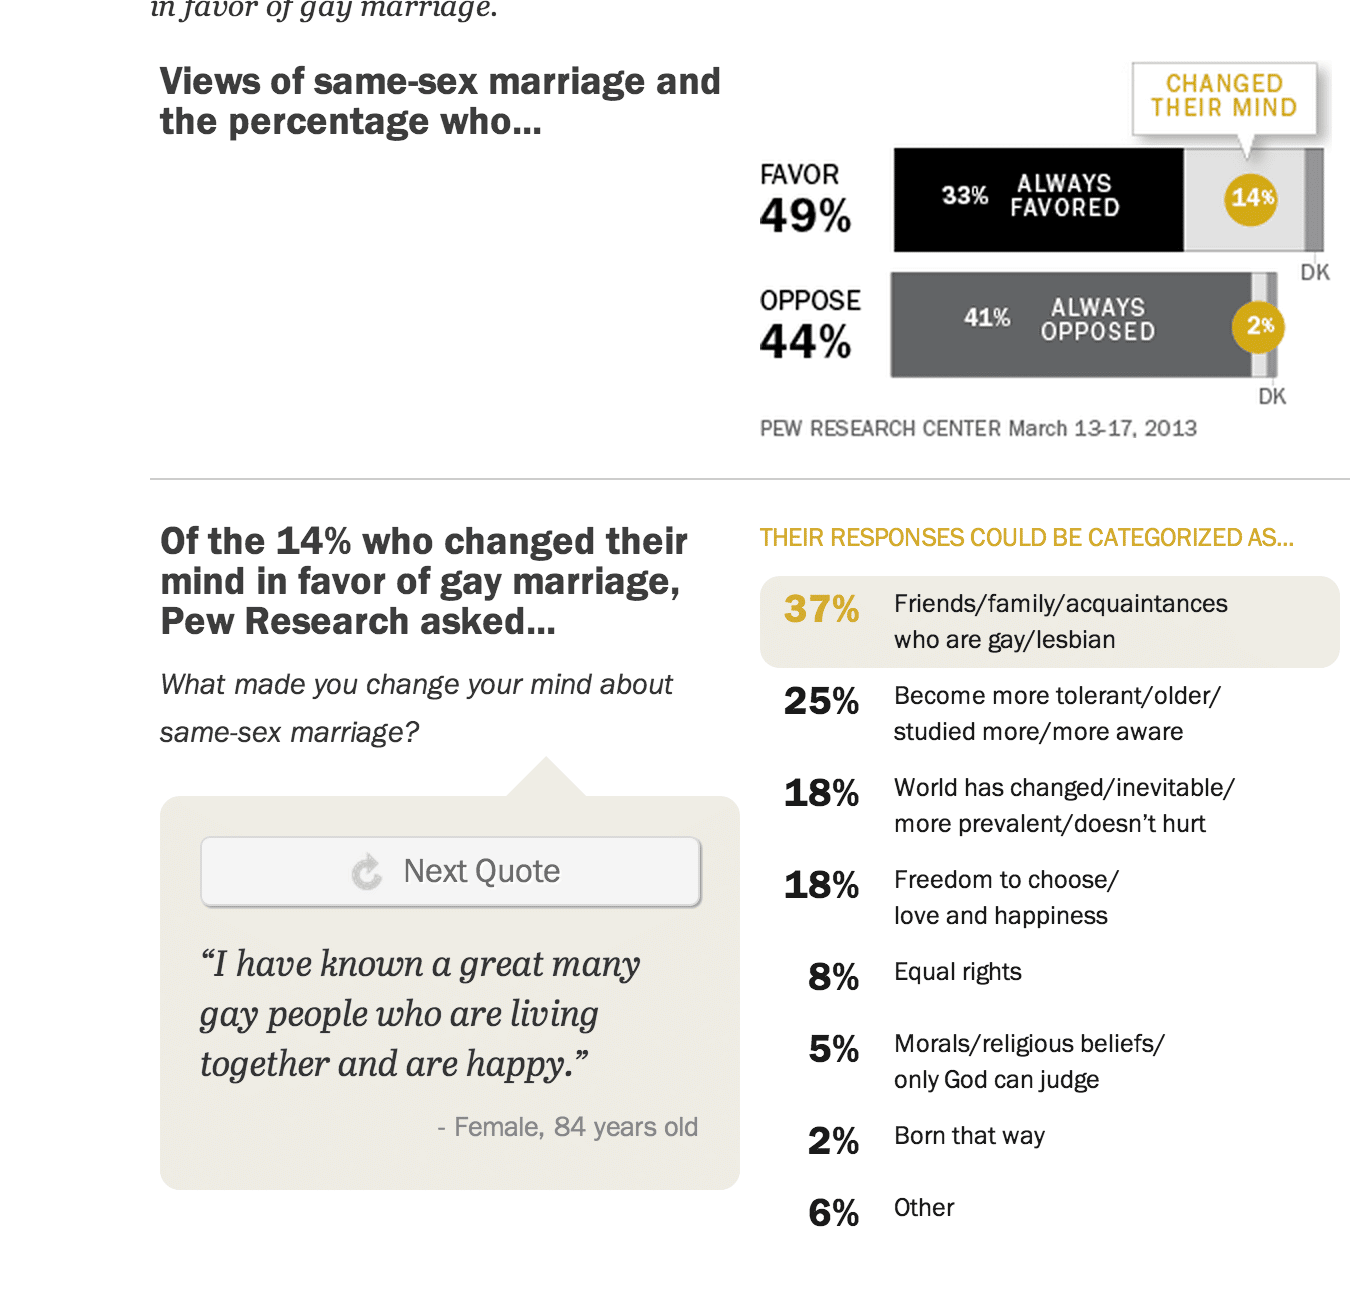
Let’s take a peek at the Pew Research Center’s latest survey on the topic of Gay Marriage:
This data chart simply shows what impacts the overall view of those people surveyed. But take a look at this chart:
Here you can clearly see the impact that demographics make on the results.
“Millennial support for same-sex marriage has grown substantially over the past decade, from 51% in 2003 to 70% today. And Millennials make up a larger share of the adult population today. In 2003, Millennials made up just 9% of the adult population. Today, 27% of adults are in the Millennial generation.”
So what?
A couple of things strike me about this research;
- The power of demographics: This has always been true and I don’t know why we ever forget it.
- Our opinions CHANGE: One thing I really like about this report is that they dig deeper into what’s behind the opinion, what impacts the opinion, how opinions have changed and what impact those changes have.
I’m curious about what you think about these results and what this says to you about the kinds of questions we should be asking.


